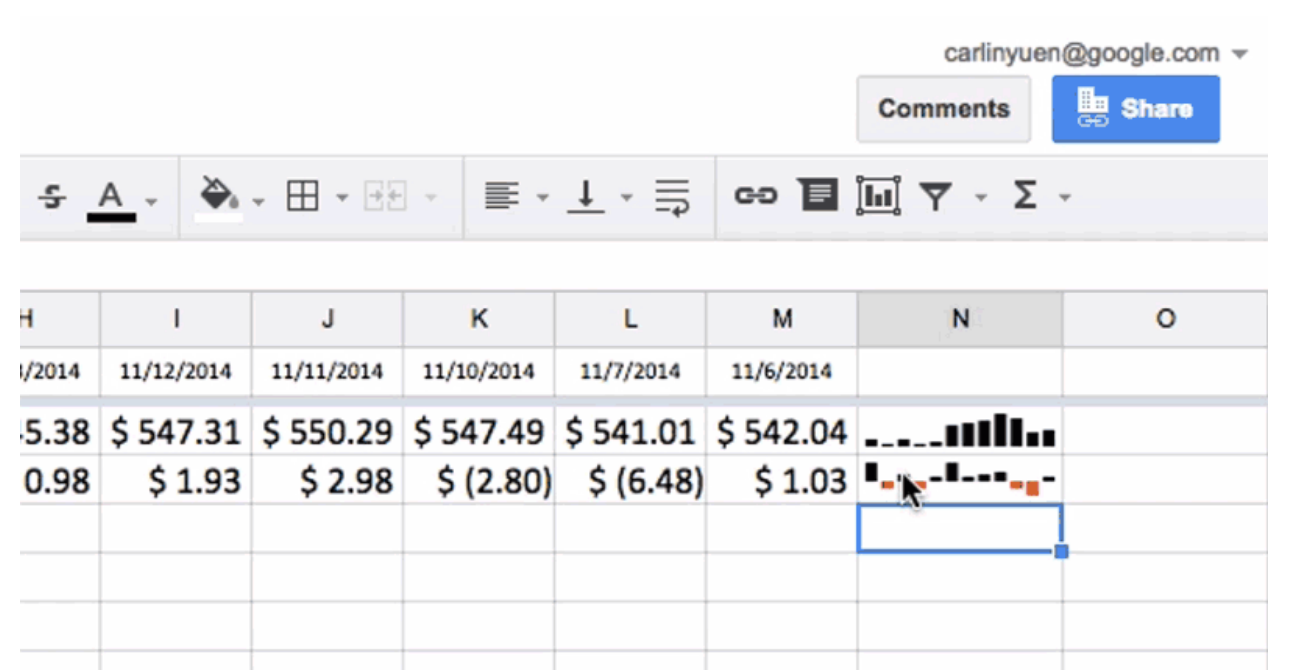
The SPARKLINE function in Google Sheets creates a miniature chart contained within a single cell, providing a quick visual depiction of data trends. With this launch, Google is adding two new types of sparklines – column and winloss – joining the existing line graph and bar chart options:
See the Help Center for details on using the SPARKLINE function.
Release track:
Rapid release and Scheduled release
For more information:
Drive G+ post
Help Center